GA4 Dashboard Explained
Tuesday, 13th June 2023


Google Analytics 4 has an entirely new dashboard (thanks Google!). This guide will walk you through how to use it to get the info you need.
Google Analytics 4 (GA4) is the latest version of Google's web analytics platform. It offers a more advanced and flexible approach to tracking and analysing user behaviour on websites and mobile apps. With GA4, you can gain valuable insights into your audience, measure conversions, and optimise your digital marketing strategies.
Our previous blog post took you through How to Set Up GA4, now that you've got that in place this post explains the GA4 dashboard.
If you’ve used the previous version of analytics, when you first log into Google Analytics 4 you’ll see there is an entirely new dashboard, and this updated interface takes a little getting used to. Almost all of the reports and metrics that were part of Universal Analytics are here, they are just called something different or in a different place.
The key components of GA4 (as shown in the graphic at the top of this page) are:
- Home
- Reports
- Explore
- Advertising
There is also a handy search bar at the top that lets you ask questions like “how many users this month compared to last month” and you’re given the answers right away.
Let’s have a look at the new dashboard.
Home Page
The home screen provides an overview of your website performance, including key metrics, trends, and highlights. It shows a high level summary of the last seven days traffic, as well as a real time view of users on the website in the last 30 minutes.
Reports
The reports section contains various reports and insights related to your website’s performance.
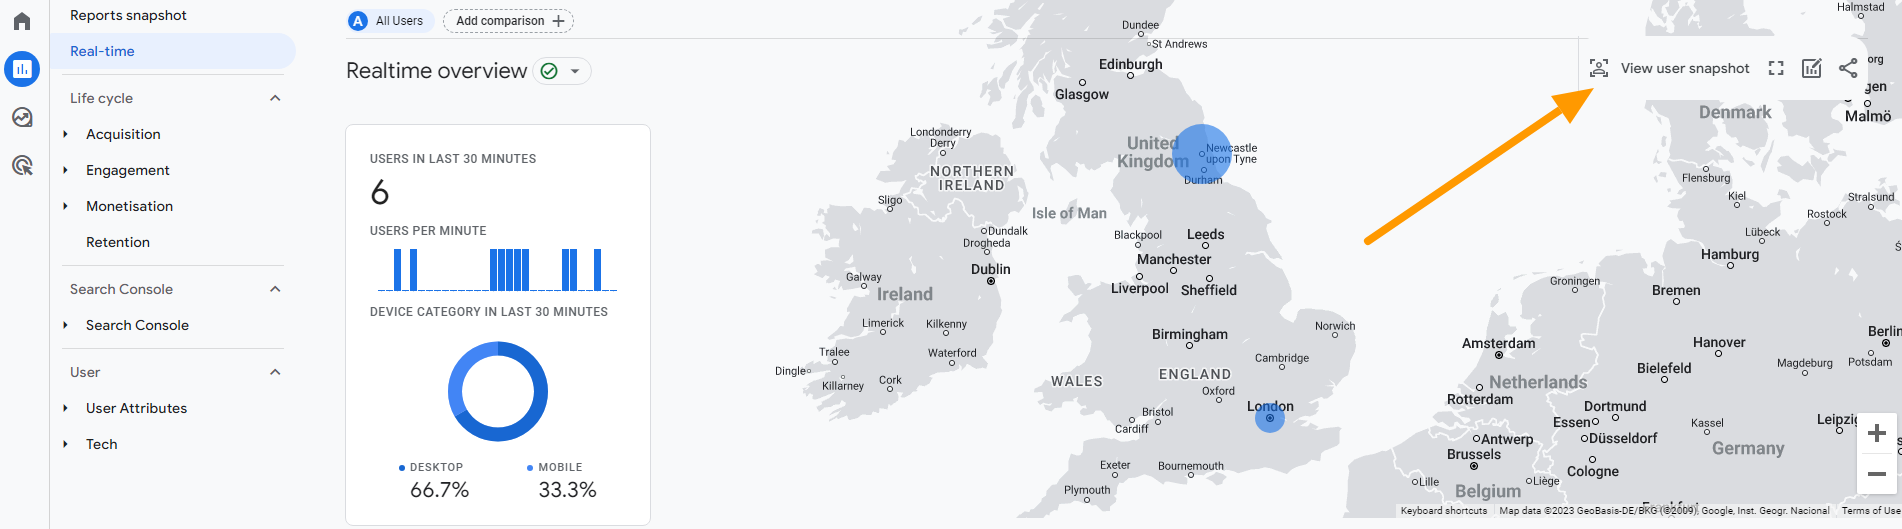
Real-time report
The real-time report shows events that happened within the past 30 minutes. A nifty new feature of GA4 is the “user snapshot” will show you a snapshot for a single user, including information about the user’s device, location, and real-time engagement with the website.
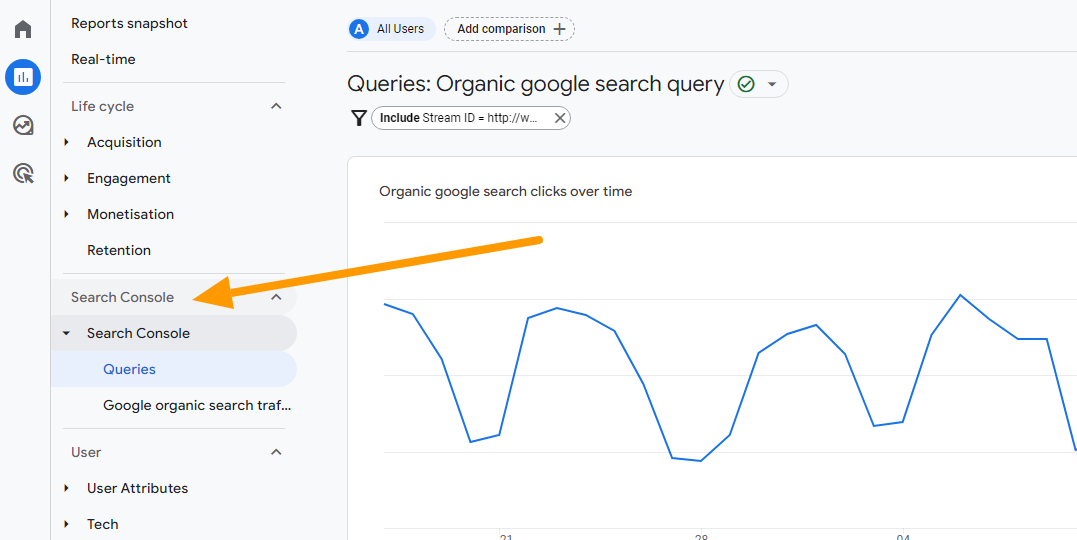
Below the real-time report there should be two types of reports when you first set up your account, life cycle reports and user reports. You can add more from the library of reports at the bottom. As mentioned in the previous post, Getting to grips with GA4, we recommend adding the search console collection, so you can see the organic search engine traffic coming to your site, and the search queries that were carried out by the people who found your site in a search engine.
Life cycle reports
Life Cycle reports show the stages of acquiring, engaging, monetizing, and retaining users. In Google Analytics 4, "user acquisition" and "traffic acquisition" are terms used to describe different aspects of analyzing and understanding user behaviour on a website, this is different to what was on the previous version of analytics.
User Acquisition
User acquisition refers to the process of attracting and acquiring new users to your website. It focuses on understanding how users discover and engage with your digital property for the first time. User acquisition metrics provide insights into the effectiveness of your marketing efforts in driving new user growth. In GA4, you can track user acquisition through various channels, such as organic search, paid search, social media, referrals, and direct traffic.
Traffic Acquisition
Traffic acquisition, on the other hand, encompasses all the sources and channels through which users access your website. It includes both new users and returning users. Traffic acquisition metrics help you understand where your website traffic is coming from and how users interact with your content across different channels. GA4 provides detailed information about traffic acquisition channels, such as organic search, direct traffic, social media, paid search, display advertising, email marketing, and more.
Engagement
One of the new metrics is ‘engagement rate’. This is based on the idea of an engaged session, which google defines as 10 or more seconds on a page, 2 or more pages views, or a conversion event and replaces bounce rate as something we can use to measure website stickiness.
The Engagement report provides a view of how effectively you are engaging your users and can be used to evaluate the performance of different pages or sections of your website. A higher engagement rate indicates that users are actively interacting with your content, while a lower engagement rate may suggest that you need to improve your user experience or content strategy to increase user engagement.
Retention
GA4 helps you analyze user retention and churn rates over time. You can gain insights into how frequently users return to your website or app and identify patterns of user behaviour. This information can help you develop strategies to improve user retention and engagement.
User reports
The user reports show the user attributes, such as demographic details, as well as the tech they used to view the website.
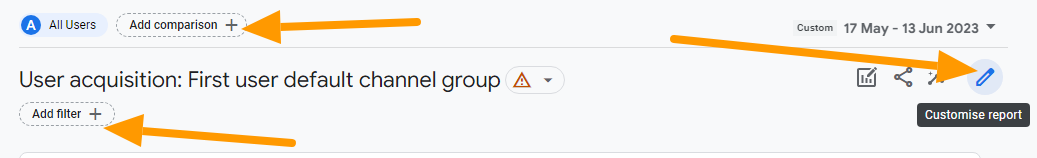
It’s fully customisable
You can customise all of the reports, to show the dimensions and metrics you need to see, and to make comparisons. You can also filter the reports to show just a specific data set or audience.
Using insights
GA4 allows you to create custom reports and analyze specific dimensions and metrics based on your unique business needs. You can customize your reports to focus on specific segments of your audience, track specific events, or compare different marketing channels.
Explore
The Explore section is something that wasn’t really a part of UA, it gives you the ability to build new customised reports but it’s not very easy to work with at first. The best way to get started would be to use the template library. This is where you can create the reports that used to use in UA but isn’t instantly available in GA4, or use the power of GA4 to show you something UA couldn’t.
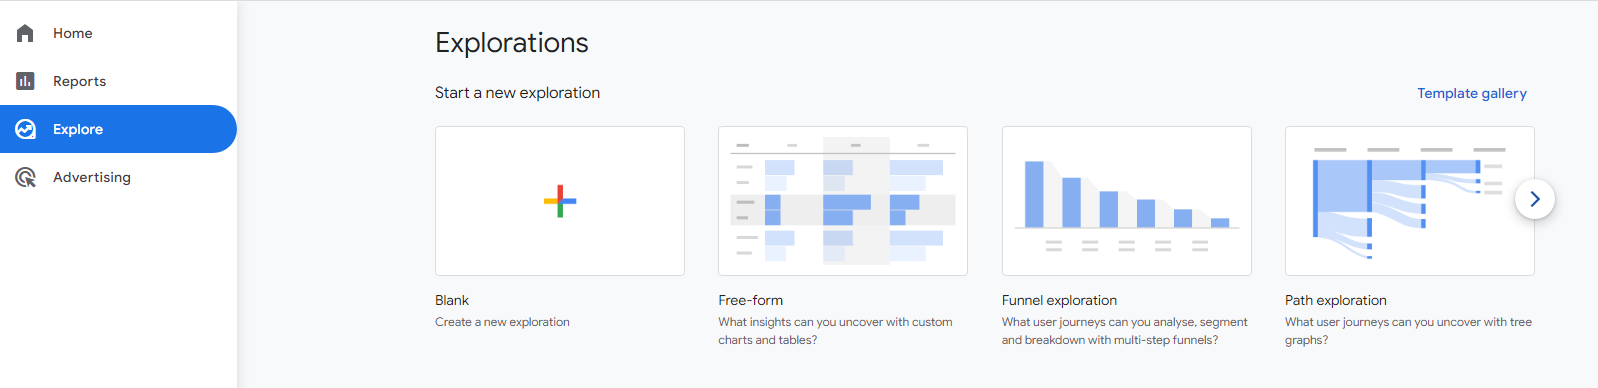
There are different parts to the explore section:
Funnel Analysis
The funnel analysis report will tell you how website visitors become one-time purchasers, and then how purchasers become repeat customers. You can visualize the steps shoppers take to complete an event and see how well they are succeeding or failing at each step.
Path Analysis
If you liked the behaviour flow reports in universal analytics, you will love the analysis hub pathing reports in GA4. Path analysis visualizes the event stream in what is known as a “tree graph.” An event stream is the series of events users triggered along their path. The path analysis technique helps marketers uncover looping behavior which may indicate users becoming stuck.
Segment Overlap
Think of a segment as a specific group of your site users. For example, a segment may be users from a specific city, those who visited a specific page, or users who took a specific action such as purchasing from a particular product category.
Cohort Analysis
A cohort is a group of users with a common characteristic, such as the same acquisition date, an event, or conversion. For example, you can create a cohort report to see how long it takes people to convert in relation to a specific marketing tactic.
User Lifetime
Lets you create reports that visualize which source is driving users with the highest lifetime revenue — not just revenue for a selected month. With GA4, you can uncover the marketing campaigns that are acquiring the most valuable users, with the highest purchase probability and lowest churn probability, thanks to Google Analytics predictions models.
When you create a report you aren’t changing any account settings or the data, so you can’t break it. And unless you share a report with others, only you can see the reports you created.
Advertising
The advertising section in Google Analytics 4 (GA4) provides insights and tracking capabilities related to your advertising campaigns. It allows you to measure the performance and impact of your advertising efforts within the GA4 interface.
By utilizing the advertising section in GA4, you can gain insights into the performance and effectiveness of your advertising campaigns. These insights can help you optimize your ad spend, refine your targeting strategies, and maximize the return on investment from your advertising efforts.
Some FAQ
How do I use the reports to measure SEO?
In Universal Analytic the Acquisition > Channels report was the most useful to see the SEO performance of the website. In GA4 the best reports are the Search Console collection and Engagement > Landing page
Why is UA and GA4 data different?
UA and GA4 have different data structures. At their foundation they are very different, which is why the data is different on the two, and why you can’t pull UA data into GA4. UA used to measure lots of different aspects of what happens on a website, GA4 just measures events.
Should we have more confidence in GA4 data?
GA4 gives us a fuller picture of what is happening on a website. GA4 has more accurate attribution models due to its advanced tracking capabilities and cross-platform tracking abilities. It was developed to track cookie-less browsing, and take privacy and user consent into account.
When you get into GA4 you'll find it's more advanced and more flexible than the previous version of analytics. With GA4 you can gain valuable insights into your audience, measure conversions, and optimise your digital marketing strategies.
If you'd like any help from us moving to GA4 or understanding the reports please get in touch.


